
Recently, I had the opportunity to complete the Cellebrite Advanced Smartphone Analysis (CASA) course, which briefly covered Apple Health Data. These pages in particular were interesting to me because Apple Health and Workout Data has been an area of continual focus and something I have frequently revisited during my career. If you are unfamiliar with Apple Health and Workout Data, I would highlight resources by Apple and some additional prior work on the subject. Cellebrite does a great job of outlining the data historically as well as detailing the healthdb_secure.sqlite database. (If you have not completed CASA, I would highly recommend the course as whole.)
Old Table, New (to me) Data
The information provided by Cellebrite within CASA, while interesting, was largely known to me – except a data_type value within the “samples” table I had not seen before during analysis and did not know was recorded within the database. (Caveat, other resources such as SANS also attribute this data_type value)
If you are familiar with the “samples” table, you likely already know the data_type values of 5 for Heart Rate, 7 for Steps Taken, 8 for Distance Traveled (in meters), and 9 and 10 for Energy (Resting and Active, respectively). You may even be familiar with the lesser known (in my opinion) 12 for Flights Climbed, 3 for Weight, 2 for Height, and 75 for Standing.
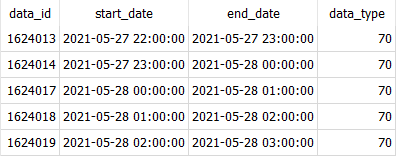
But this article is about 70. 70 is associated with any hour the Watch is worn by the user. Visually, as displayed through DB Browser for SQLite, the “samples” table filtered for data_type 70 is as follows:

And that is it. Four simple columns – filtered to 70. Initially, not a lot there until we look deeper. Note: the “samples” table formatting has not changed from iOS 15, iOS 16, or iOS 17, so this data is consistent across those iOS versions.
We can see we also have a start_date and an end_date. The difference between these columns is 3600 – or 3600 seconds since we know these are timestamps. This is easiest to see within our fifth row (data_id 1624019). 3600 seconds is equal to 1 hour. From this, we can observe that the database records when the user is wearing their Watch in one-hour intervals. With a quick SQL query, we can generate this data into a more readable format, again displayed within DB Browser for SQLite:
Within the above image we can see the end_date value for data_id 1624013 is the start_date value for data_id 1624014, the next row of data. This indicates that the user, at some point between 2200 and 2300, put on their Apple Watch. We can see the Apple Watch was then still worn until sometime between 0200 and 0300 as the data trend of the end date matching the following start date continues.
We can also see periods of time where the Watch was not worn by the user from review of this data. Looking at more data from the “samples” table:
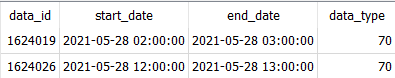
Review of this data reveals the Watch was worn by the user between 0200 and 0300 then not worn again until sometime between 1200 and 1300. From this data we can see periods the Watch is worn and periods, whether for charging requirements or other reasons, the Watch is not worn.
As an examiner or investigator, this data and the correct interpretation of such could be extremely beneficial to an investigation. This information could be helpful for establishing a pattern-of-life analysis or for a quick data review to determine if other useful information (such as heart rate data) will be present within the database for a specific time period. With one-hour data intervals it is important to note that whether the Watch was put on at 2201 or 2259, through testing, the database will propagate data for this time period.
If you have read any other work I have completed involving SQLite databases, you will know I am a big fan of creating SQL queries that not only select the relevant data from the database but that also presents the values visually in, ideally, the easiest and most understandable format. This data was no different; however, the SQL query was a bit more complex. Note: Because it is more involved, I will not be covering all aspects of the query and a line-by-line review of how it works but it will be submitted to iLEAPP and available on our company Github.
Our SQL query breaks down this data into the following return:

Now, quite quickly, we can see:
• the user put on the Watch sometime between 1200 and 1300
• they wore the watch for 40 hours
• the Watch was last worn between 0300 and 0400
• the Watch was not worn for 8 hours
• the Watch was put on once more sometime between 1200 and 1300
During this 40-hour Watch worn period we can rely on the fact the device could record data such as heart rate, steps taken, distance traveled, energy burned, flights climbed, standing, and workouts.
Looking at the data for rough pattern of life analysis we can see this user, on average from these rows, wears the Watch for about 40 hours before removing it for about 8 hours.
The addition of this artifact, indicating when the Apple Watch is worn, opens up new opportunities in digital forensics and analysis. Despite its relative obscurity and the fact that many current digital forensics tools do not yet parse this data, it holds significant potential for investigations. This data can help establish patterns of life analysis for Watch usage, which can, in turn, offer insights into user behavior and timelines. The ability to accurately interpret this data may lead to breakthroughs in understanding crucial events or verifying other digital forensic evidence available in these time periods. As more digital forensics software incorporates this data point, it could become a key resource for investigators seeking a clearer view of user activity and device interaction when Apple Watch is present.

Leave a comment